
1. Data collection
The Crime data is obtained through the official site of statistics of Parà Consulta de Dados Estatísticos Criminais (CODEC)
CONSOLIDADO(S),ESPECIFICAÇÃO CRIME,MEIO EMPREGADO DEAC,MUNICÍPIO(S),BAIRRO(S),ANO DO FATO,MÊS DO FATO,RISP,AISP,DATA DO FATO,DIA DA SEMANA,HORA DO FATO,FAIXA 4 HORAS,FAIXA 12 HORAS,LATITUDE,LONGITUDE,DISTRITO,REGIÃO DE INTEGRAÇÃO,LOCAL DA OCORRÊNCIA,SEXO VÍTIMA,IDADE VÍTIMA,FAIXA ETÁRIA VÍTIMA,TIPO DE VÍTIMA,COR VÍTIMA,GRAU DE INSTRUÇÃO VÍTIMA,ESTADO CIVÍL VÍTIMA,SEXO AUTOR,IDADE AUTOR,COR AUTOR,GRAU DE RELACIONAMENTO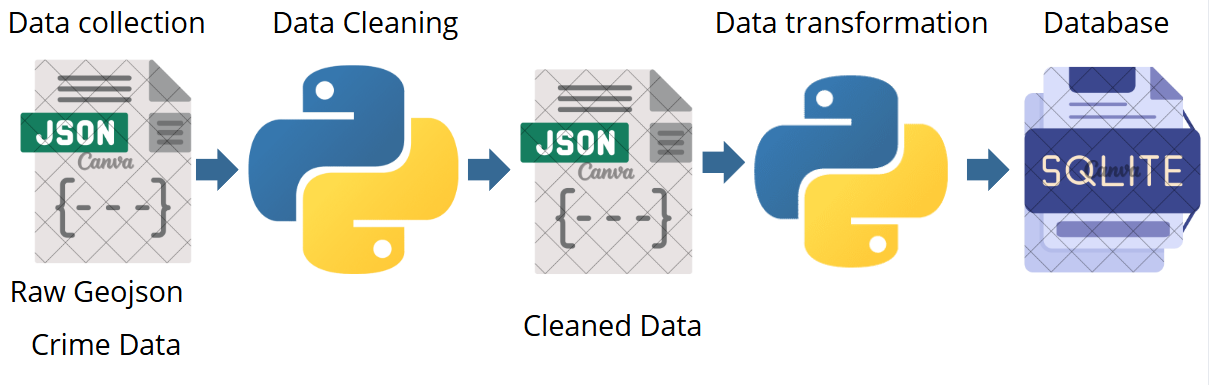
The geospatial data is from IBGE in shapefile, cleaned with python and qgis. Some missing geospatial data can be obtained from Openstreetmap using their APIs.
The 2022 Censo data is from IBGE and is used to enrich the geojson file of each region of data from the 2022 Censo.
2. Data Cleaning
The raw data data gets cleaned:
- Since the main goal is geospatial visualization, rows with missing latitude and longitude are removed.
- Handling missing values and formats (Dates are formatted properly,etc..)
- Incorrect polygons in shapefiles are corrected with qgis.
3. Data Transformation
The data is transformed into a structured SQLite database. This format allows for efficient data access, quick querying, and seamless integration into the platform. The geospatial data is enriched with more features by aggregation and by position from the 2022 censo and with the crime data.
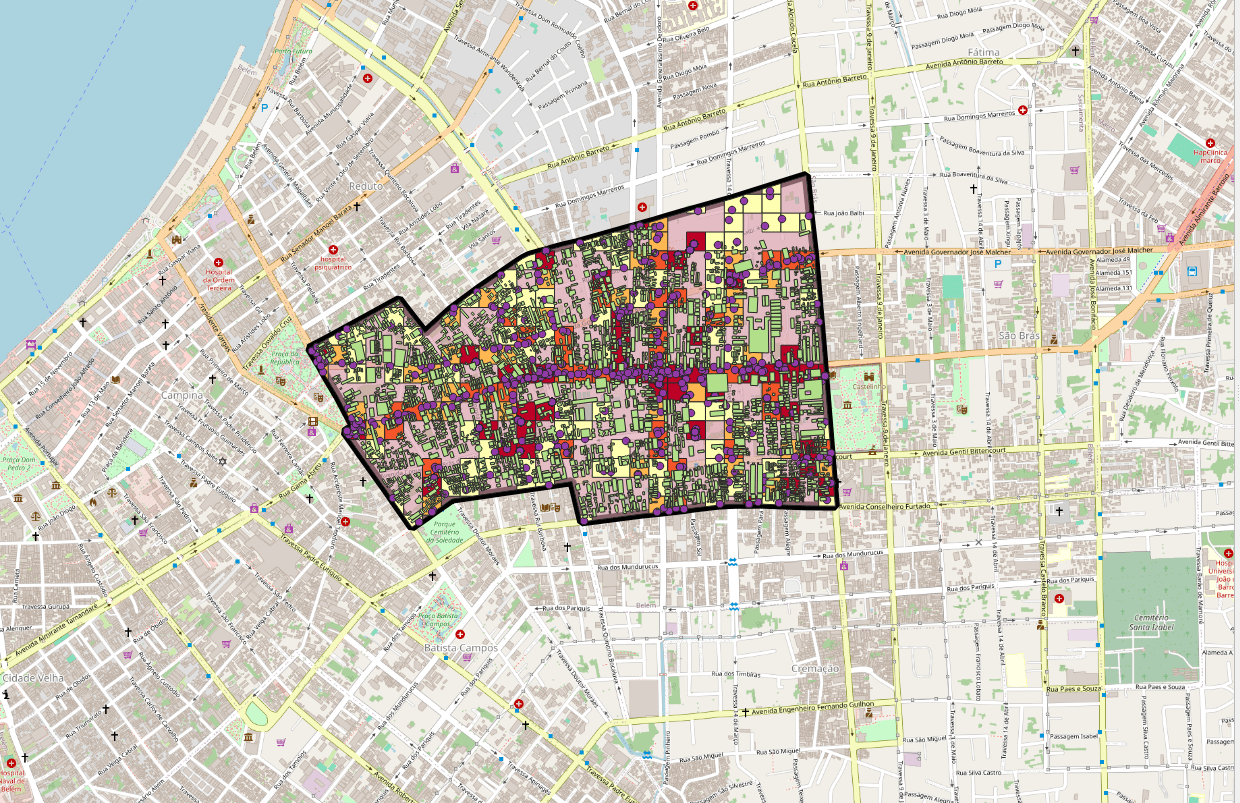
4. Visualization: QGIS
The geojsondata is loaded with qgis, a powerful tool to visualize, analyze geospatial data. Sectors data and a fishnet help to divide the problem to smaller section to then make a prediction.
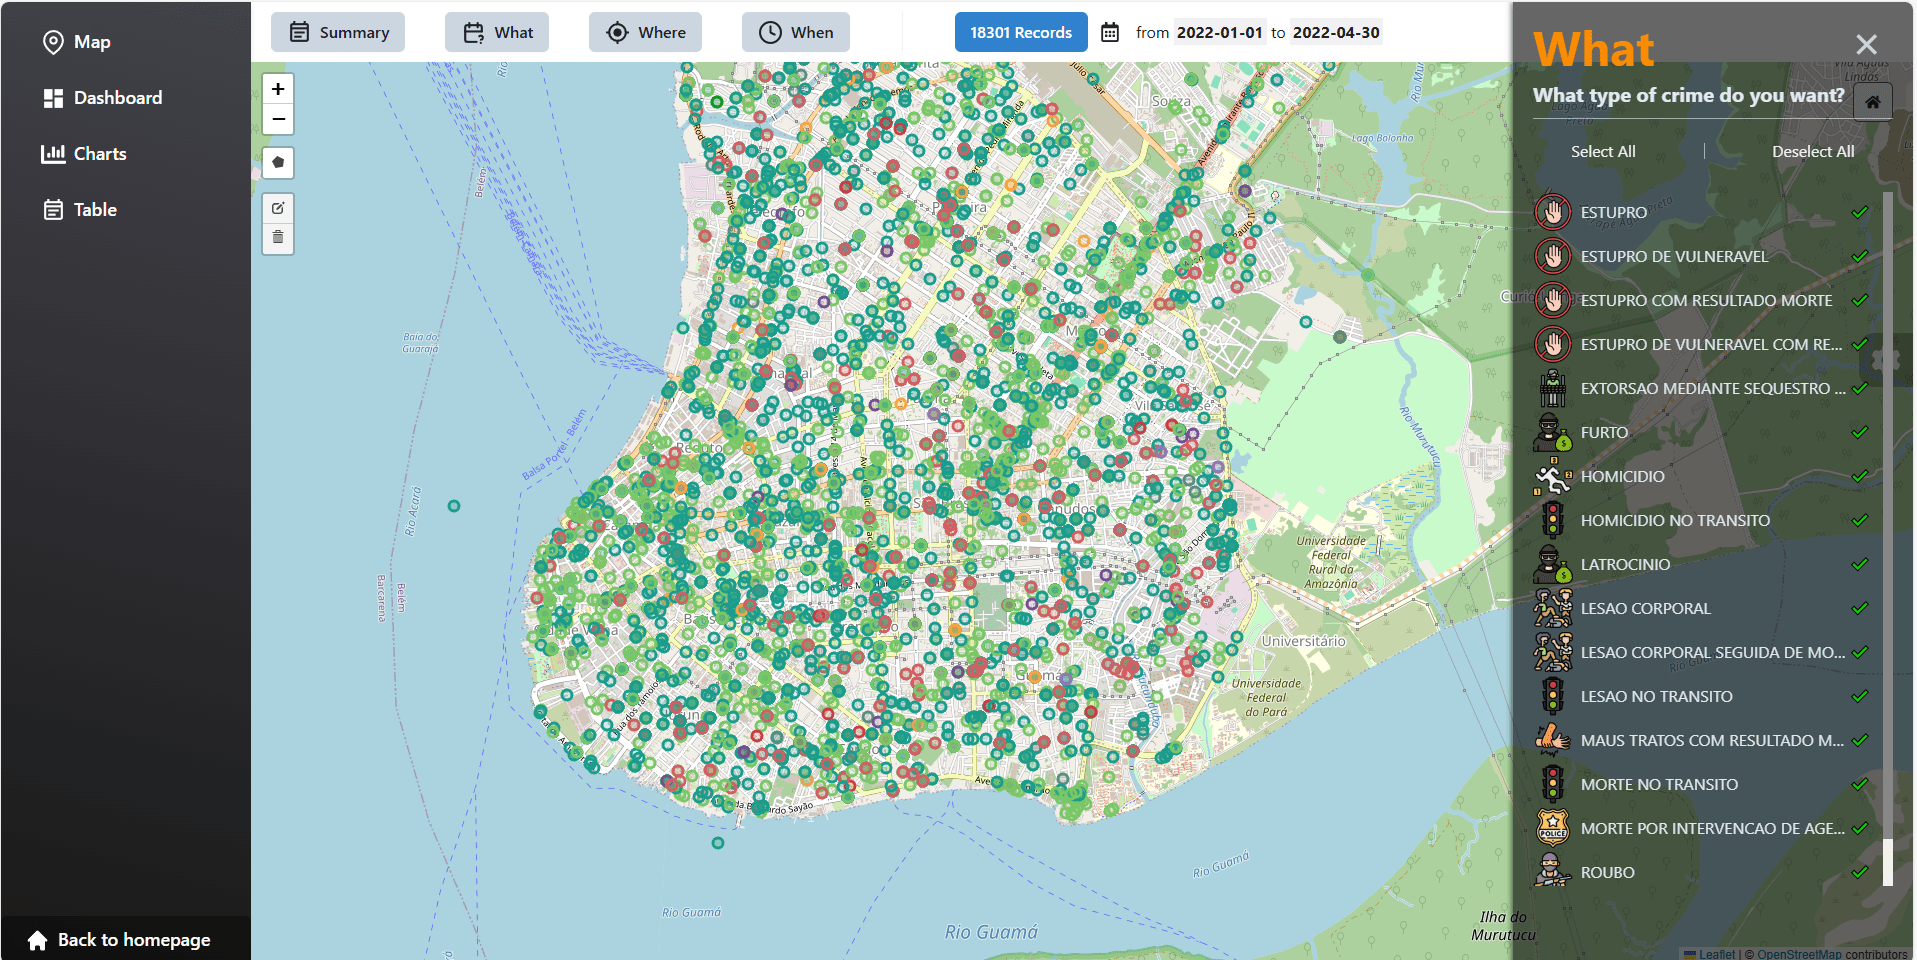
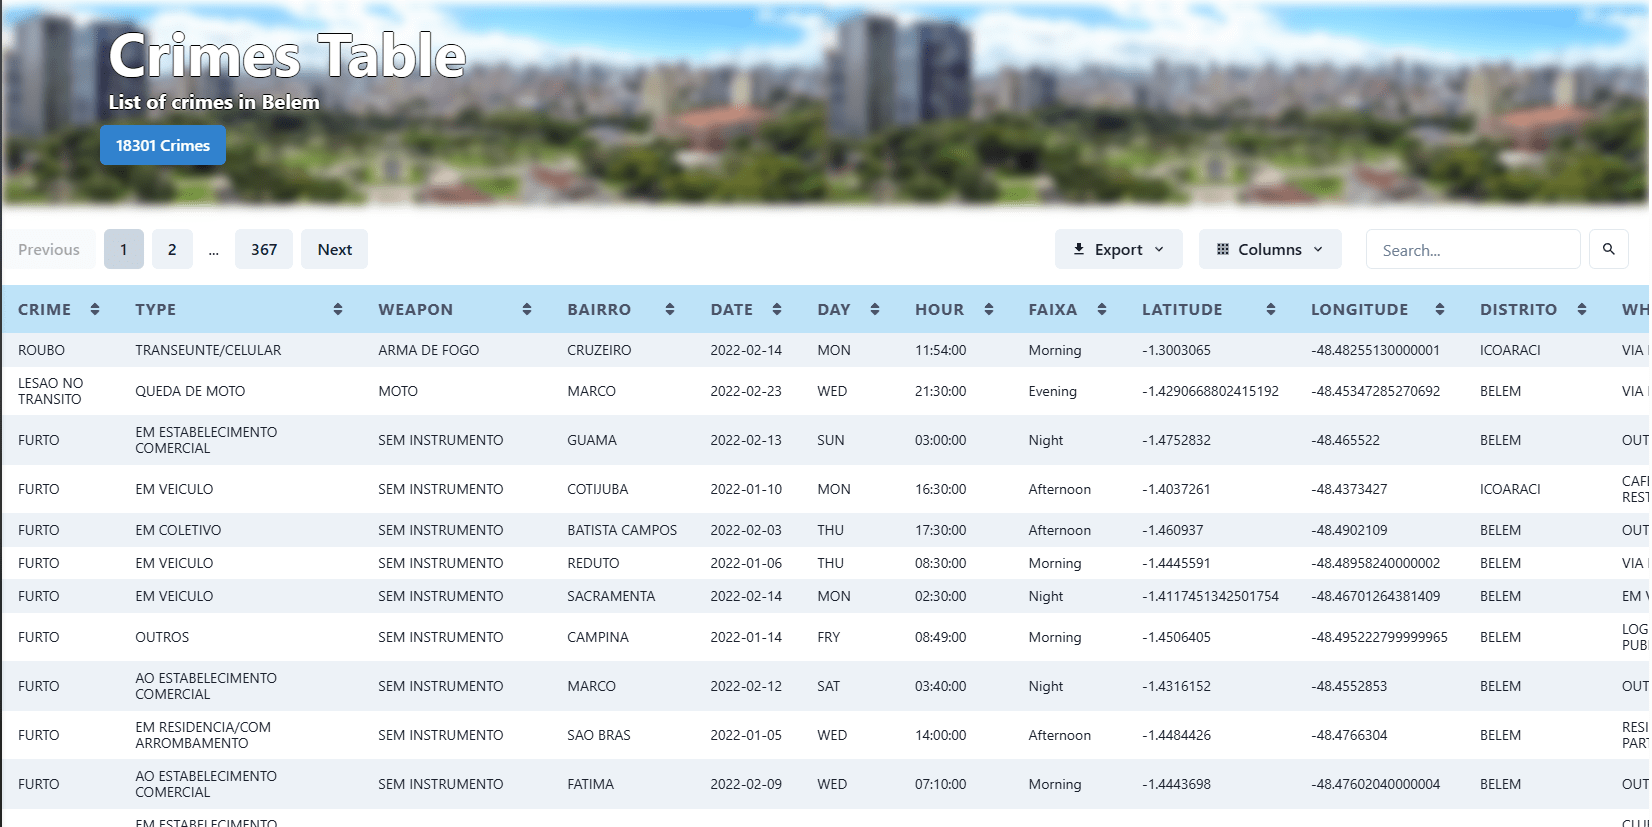
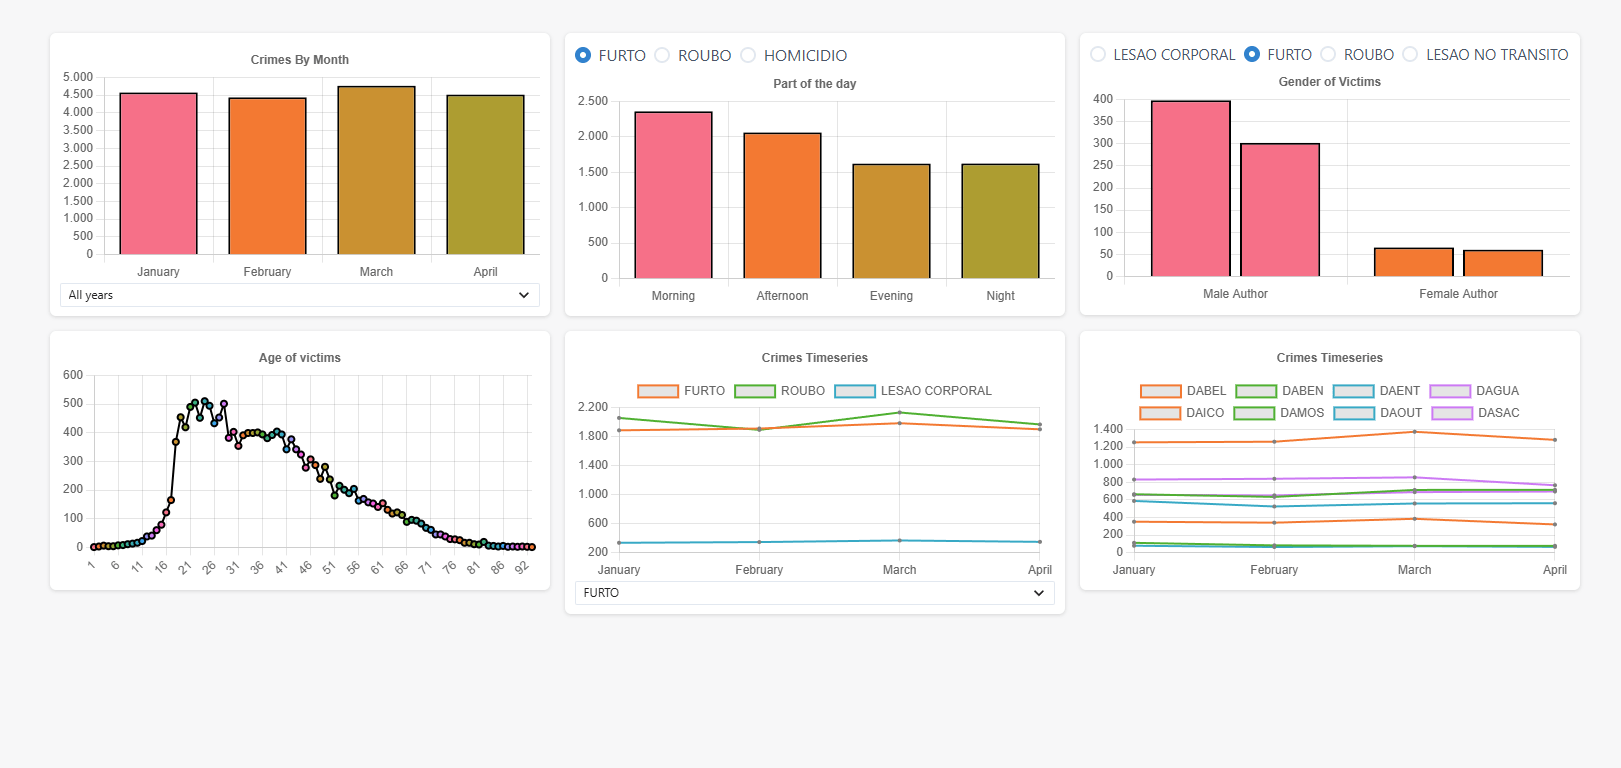
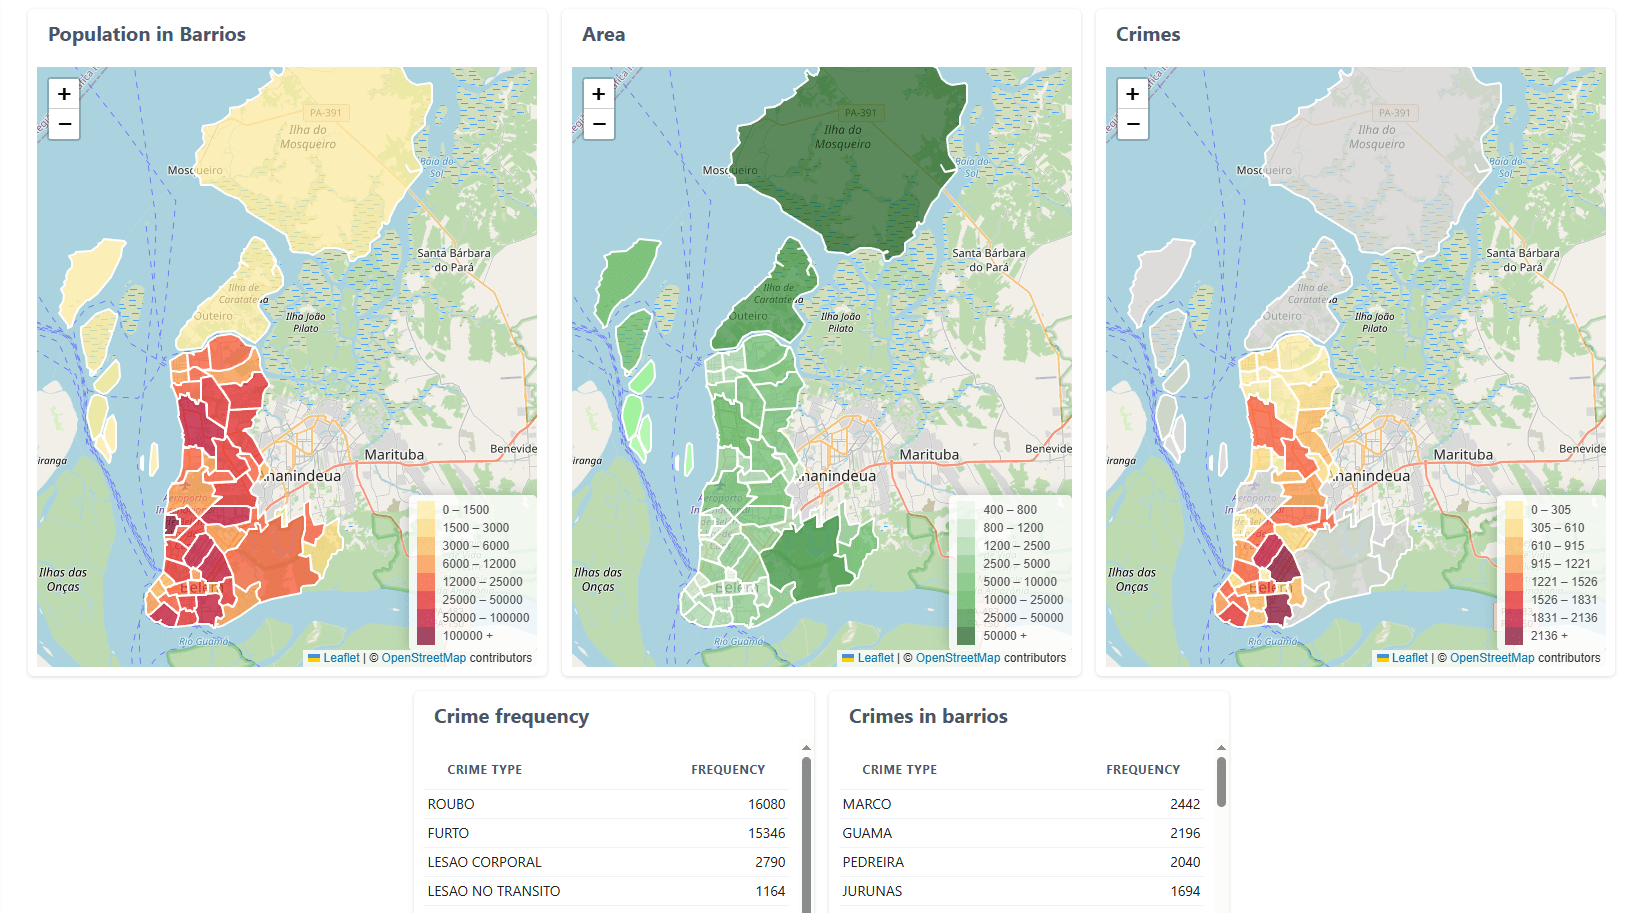
5. Interactive Dashboard
A web platform for navigating crime data, allowing users to explore what crimes occurred, where they happened, and when they took place. Users can filter and combine these parameters to view the data in a table or visualize patterns and relationships through interactive charts.
Data prediction
6. Python analysis
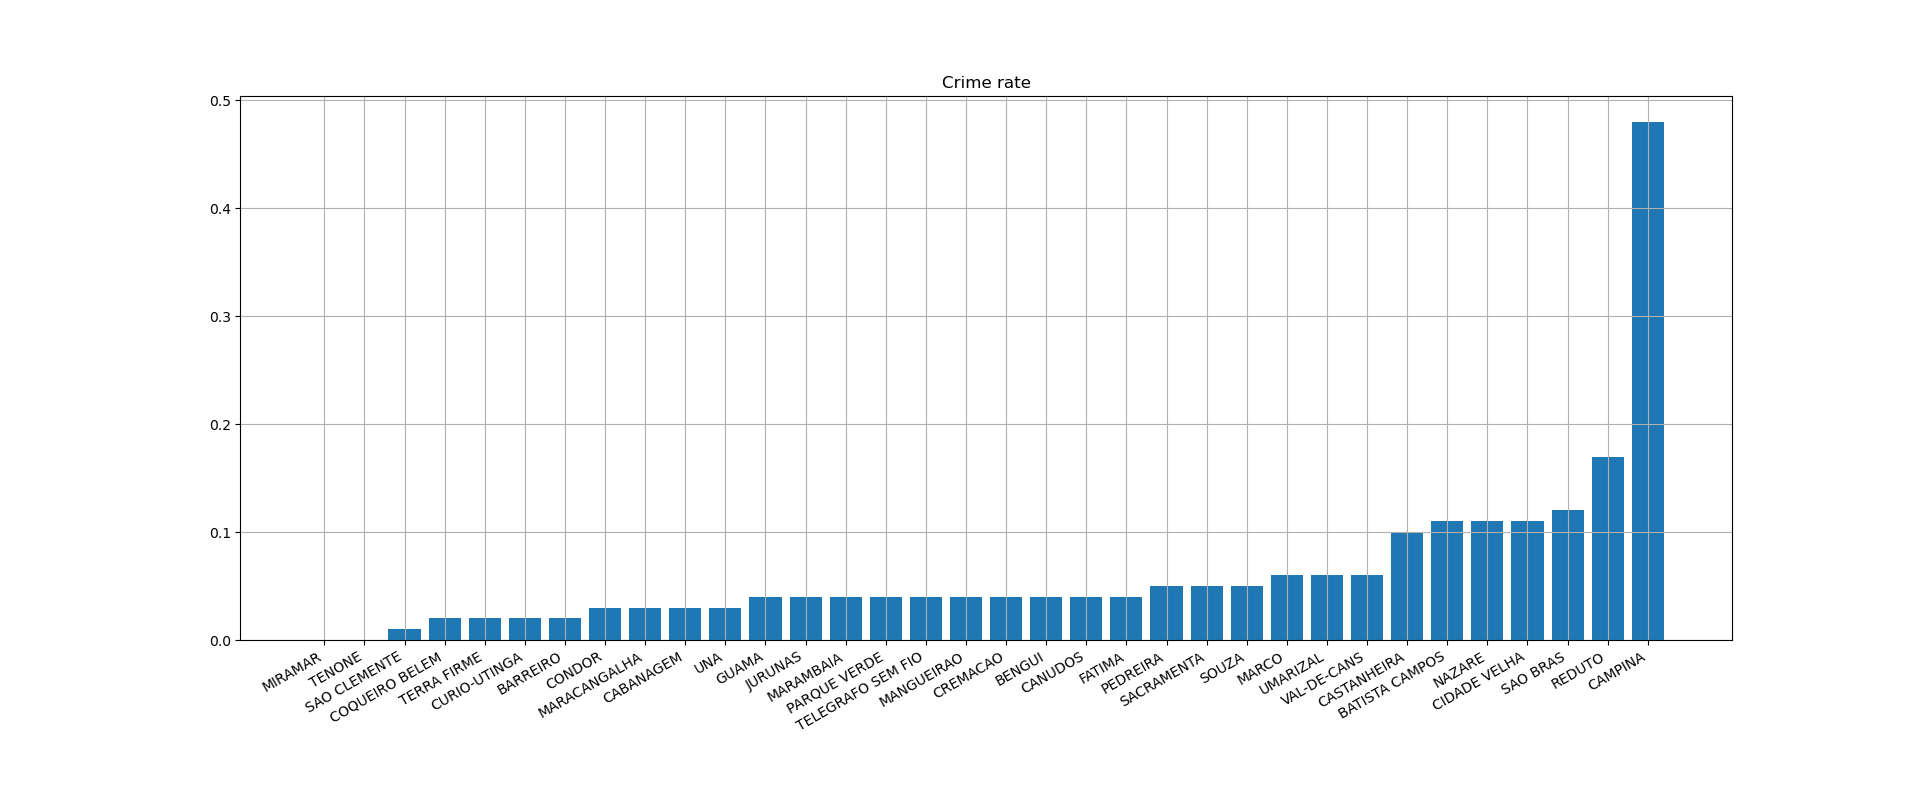
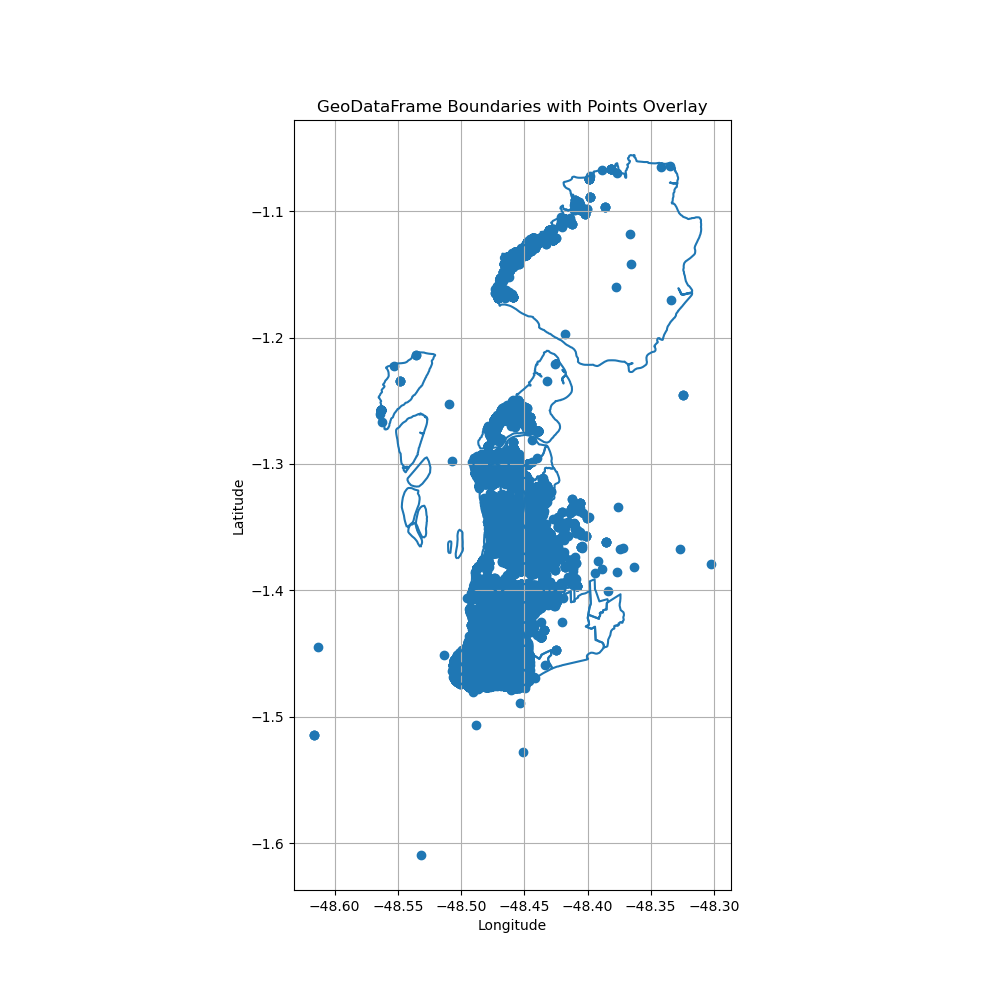
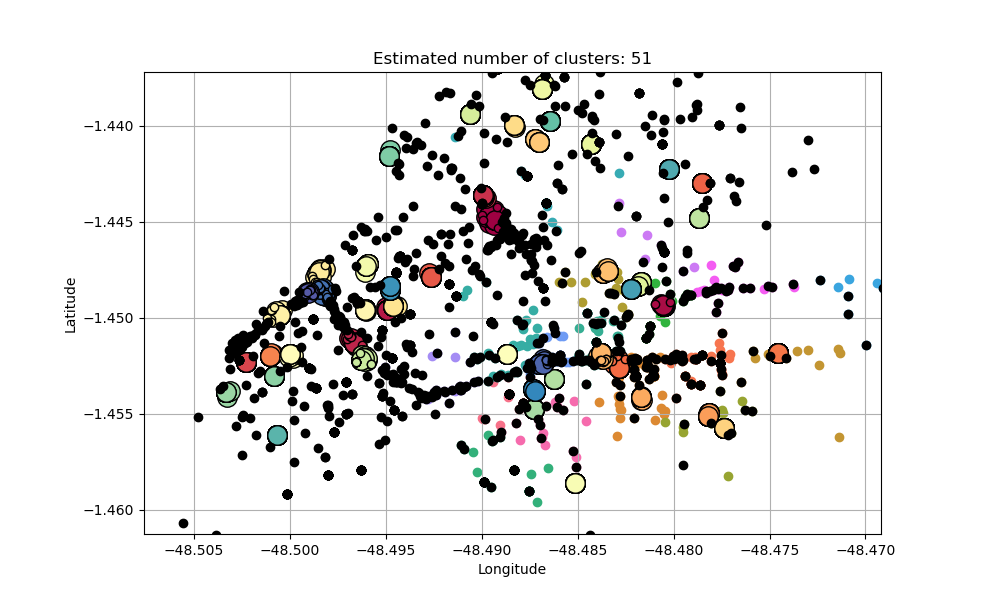
EDA
Data exploration is done with to have a first look at the data to find patterns and to check if the data has something to tell to us like area that form clusters indicading populated area with high crimes, dangerous streets or crime organizations.
Subdivide geojson with QGIS
Each raster cell contains crime data and variables for the prediction
QGIS Steps:

1. Create fishnet for Belem
2. Load Sector from PA_Setores2021.zip
3. Load every feature (like OSM Bus data,etc..)
4. Join attributes by Intersection with Fishnet
5. Make prediction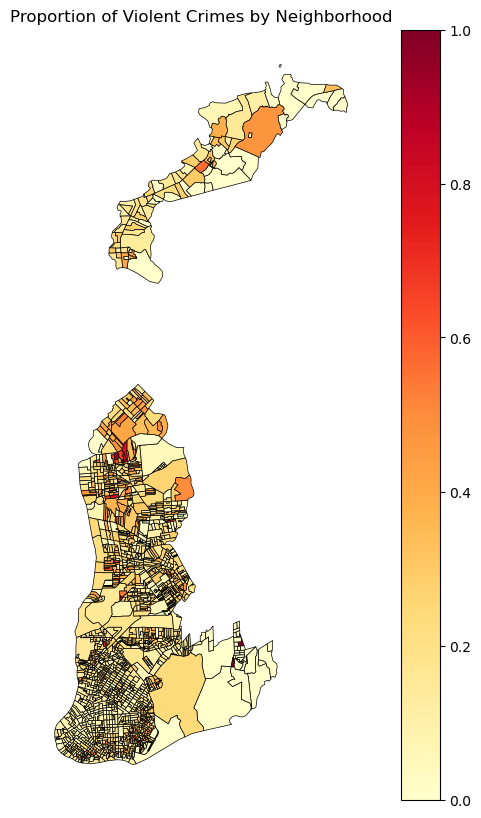
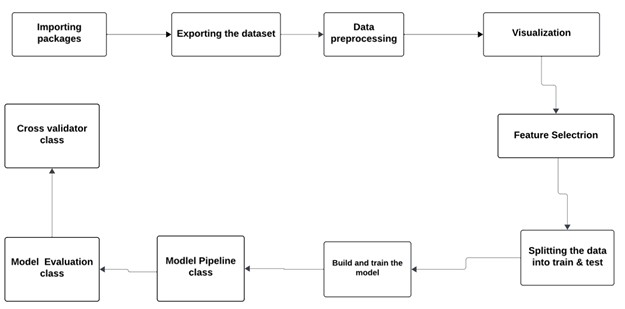
Modelling
Logistic Regression
One useful model to create is the classification of cells by crime happening or not happening in a determed span of time.
Using
y = {
    1, # Cell with accident,
    0 # Cell without accident
}
LRM is used o to measure the relationships between the dependent variable and thepredictors. The logistic regression model’s output is a predicted transformed logistic (logit)probability map with continuous values ranging from 0 to 1
The inspiration is from a well structured study analyzing traffic accident in iran.

In this case:
KNN and Random Forest Classifier outperformed the Logistic Regression with high precision suggesting fewer false alarms.
References
[1] (Pedestrian Road Traffic Accidents in Metropolitan Areas: GIS-Based Prediction Modelling of Cases in Mashhad, Iran)(https://www.researchgate.net/publication/372109711_Pedestrian_Road_Traffic_Accidents_in_Metropolitan_Areas_GIS-Based_Prediction_Modelling_of_Cases_in_Mashhad_Iran)
Data analysis
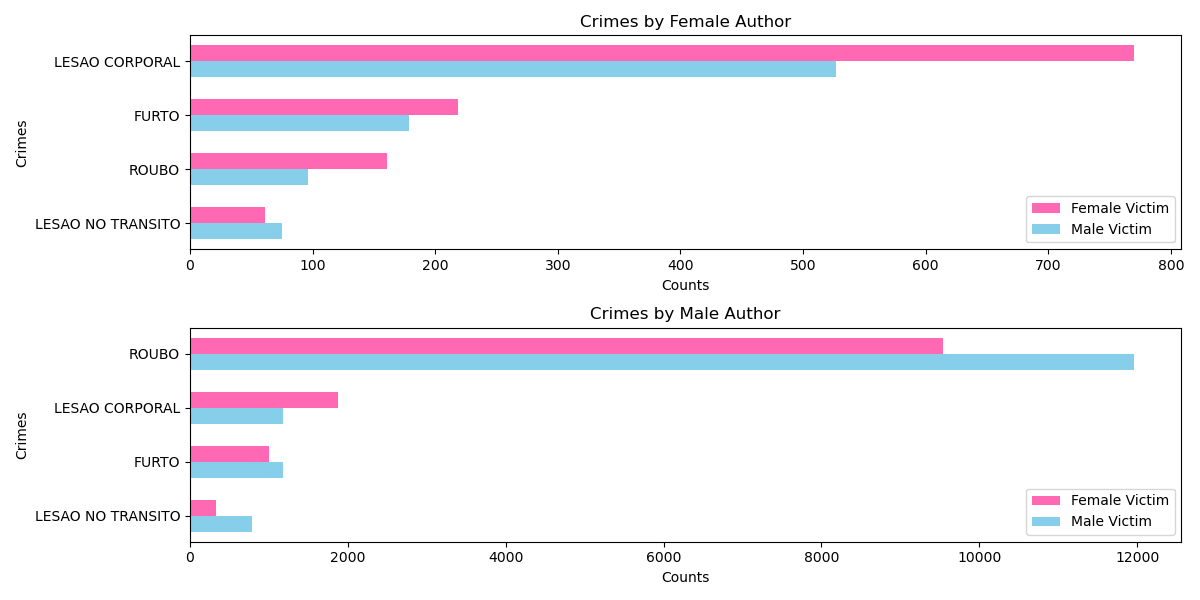
With an accuracy of 83% given also the high amount of data spannig 3 years is successful predicting the type of crime given the crime variables used.
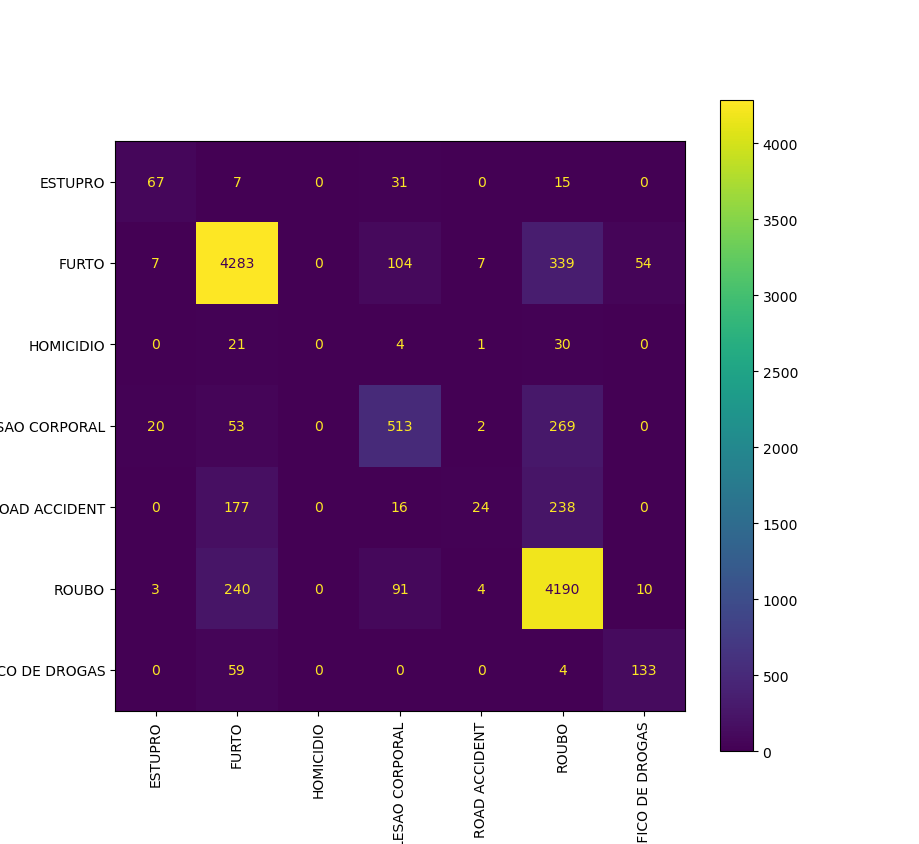
But this result is caused by the high correlation of Crime type with Weapon used that determine crimes like "Roubo" and "Furto" rapresenting the majority of the dataset. The highly imbalanced data make the model guess the higher occurrences making the prediction unreliable.