
Sugiyama Methodology
What is it
Layered graph drawing or hierarchical graph drawing is a type of graph drawing in which the vertices of a directed graph are drawn in horizontal rows or layers with the edges generally directed downwards. It is also known as Sugiyama-style graph drawing after Kozo Sugiyama, who first developed this drawing style.
The Sugiyama Method(or the Sugiyama-framework) is the gold standard for creating layered drawings or DAGs. The layout algorithm consists of four-major steps: Cycle Removal, Layer Assignment, Crossing Reduction, and Straightening and Packing.
The problem
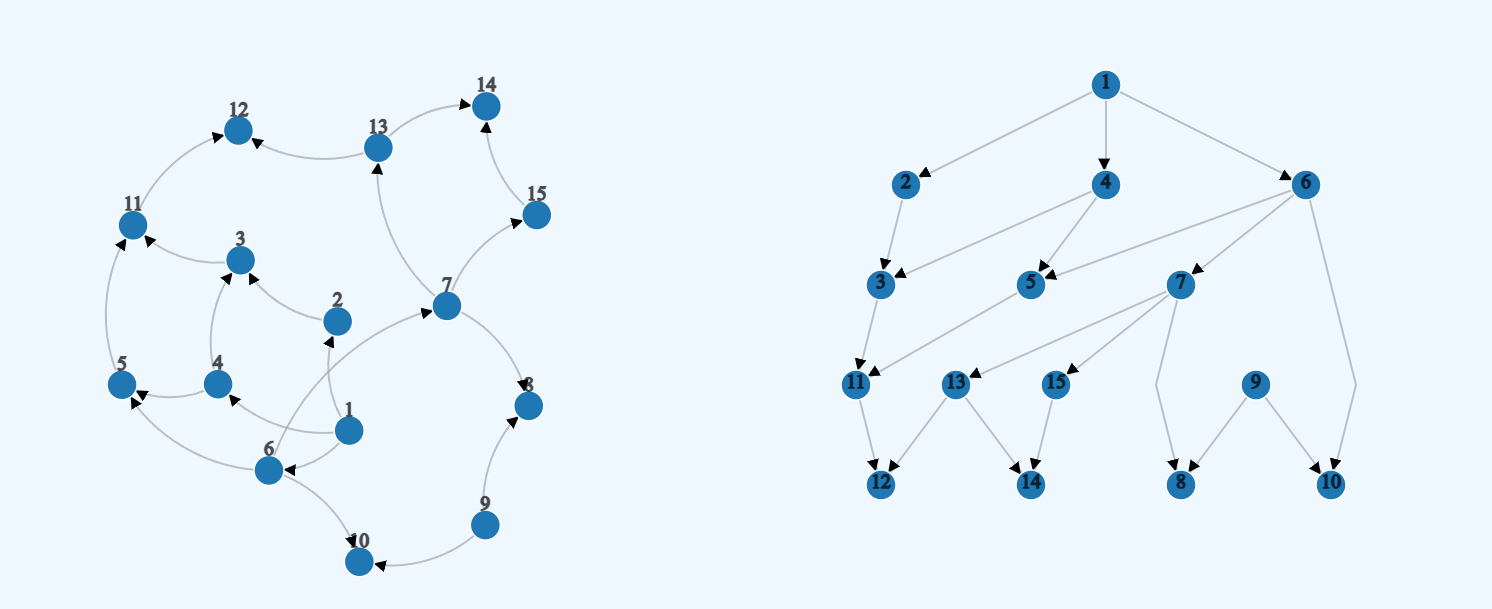
Given a Direct Graph
1. Cycle removal :
Make the graph a DAG (Directed Acyclic Graph). By inverting the direction of some of the edges we remove every cycle.

2. Layer assignment
Assign nodes to layers, discretes y-coordinates and adding dummy nodes for long edges (spanning multiple layers)

3. Crossing removal
Ordering nodes across layers to minimize intersections. Here we add dummy nodes.

4. Assign coordinates
Assign exact X-coordinates and remove dummy nodes*.

5. Drawing
Draw the actual lines/curves and nodes.
Implementation
export function SugiyamaMethodology(inputGraph:IGraph){

    printGraph(inputGraph);
    console.log("Is cyclic?",inputGraph.isCyclic());

    // Remove Cycle by inverting some edges
    let gcr = new GreedyCycleRemoval(inputGraph);
    let invertedEdges = gcr.removeCycle();

    console.log("Inverted Edges:",invertedEdges);
    console.log("Is now cyclic?",inputGraph.isCyclic());

    // Calculate Longest Path Layering
    let lpl = new LongestPathLayering(inputGraph);
    let { layers, graphDummy } = lpl.computeLayering();

    //Remove Crossings using barycentr algorithm
    let cr = new CrossingRemovalBarycenter();
    cr.removeCrossings(layers,graphDummy);

    // Assign coordinates
    let ca = new CoordinateAssignment();
    let coordMap = ca.assignCoord(layers);

    return {layers, graphDummy, coordMap};

}
1. Cycle Removal
-
Find the feedback arc set R by performing a DFS that determines the ordering and adding all the back edges to R
- Reverses |E| - |V| + 1 edges
-
Choose an ordering arbitrarily and count the number of leward edges
If greater than half of the edges, choose the opposite ordering- Ensures that R is less than half of the edges
Step 1: Greedy Cycle Removal
To identify a feedback arc set R through a vertex ordering and subsequent removal of the leward edges
private invertLewardEdges(){
    let vertexOrder = this.findGreedyOrder();
    let lewardEdges = [];
    for(let edge of this.graph.getEdges()){
        let s = edge.getSource();
        let t = edge.getTarget();
        if(vertexOrder.indexOf(s) > vertexOrder.indexOf(t)){
            lewardEdges.push(edge);
        }
    }
    // Invert Edges
    for(let edge of lewardEdges){
        this.graph.invertEdge(edge);
    }
    return lewardEdges;
}
2. Longest Path layering
The longest path algorithm of Tamassia determine a layering with the minimum number of complexity O(n+m)
private assignLayers() {
    let graph = copyGraph(this.graph);
    // Define Layers
    let layers = [];

    while (graph.getSink()) {
        let sinks = graph.getAllSinks();

        layers.unshift(sinks);
        for (let sink of sinks) {
            graph.removeNode(sink);
        }
    }
    return layers;
}
let layers = this.assignLayers();
let graphDummy = this.createDummyVerteces(layers);3. Crossing Removal
 removeCrossings(
        layers: IVertex[][],
        graph: IGraph,
        iterations = 4
    ) {

        for (let iter = 0; iter < iterations; iter++) {

            // 🔽 Downward sweep
            for (let i = 1; i < layers.length; i++) {
                this.orderLayer(layers[i - 1], layers[i], graph, true);
            }

            // 🔼 Upward sweep
            for (let i = layers.length - 2; i >= 0; i--) {
                this.orderLayer(layers[i + 1], layers[i], graph, false);
            }
        }
    }

 private orderLayer(
        fixedLayer: IVertex[],
        freeLayer: IVertex[],
        graph: IGraph,
        useIncoming: boolean
    ) {

        const pos = new Map<IVertex, number>();
        fixedLayer.forEach((v, i) => pos.set(v, i));

        const originalIndex = new Map<IVertex, number>();
        freeLayer.forEach((v, i) => originalIndex.set(v, i));
        // Compute Barycenter
        const bary = this.computeBarycenter(
            pos,
            freeLayer,
            graph,
            useIncoming
        );
        // Order Barycenter
        freeLayer.sort((a, b) => {
            const diff = bary.get(a)! - bary.get(b)!;
            return diff !== 0
                ? diff
                : originalIndex.get(a)! - originalIndex.get(b)!;
        });
    }
4. Coordinates Assignment
assignCoord(layers: IVertex[][]) {

    let map = new Map<IVertex, { x: number, y: number }>();

    let maxLayer = Math.max(...layers.map(l => l.length));

    for (let i = 0; i < layers.length; i++) {
        const dx = (maxLayer * this._xSpacing) / layers[i].length;

        let x = dx / 2;
        let y = i * this._ySpacing;

        for (let v of layers[i]) {
            map.set(v, { x, y });
            x += dx;
        }
    }

    return map;
}
5. Drawing
For rendering and visualization, we use D3.js, a powerful JavaScript library for creating dynamic and interactive data-driven graphics. D3 provides control over DOM and SVG elements, allowing us to render nodes using the calculated x and y coordinates.